k6 in practice: open vs closed models, per-endpoint thresholds, checks that count, and finding the limit
ProvaLab team · · 12 min read
Your first load test with k6 covered the basics: virtual users, thresholds, checks, and a stress test that found where an API slows down. This guide is about the mistakes that come next. They are easy to make, because each produces a green run that looks fine.
The task: FoodNow, the food delivery app we use as the example across our posts, is planning a lunch promotion. The business wants 60 orders a second for a minute, with orders answered in under 300 ms at the 95th percentile. We'll write the test most teams write first, watch it pass, and then find out why it shouldn't have.
Every run below is real, on one laptop, with:
| Tool | Version |
|---|---|
| k6 | v2.4.0 (Docker image grafana/k6) |
| FastAPI | 0.162.5 |
| uvicorn | 0.54.0 (one worker) |
The API under test (example code)
This is a small API we built for the guide, with two problems planted on purpose. Placing an order holds a lock for 20 ms, the way a row lock on the stock table would, so at most about 50 orders a second can get through. And when a dish sells out, it answers 200 OK with an error in the body.
# app.py: example API for this guide, not production code
import asyncio

from fastapi import FastAPI
from pydantic import BaseModel

app = FastAPI()
MENU = [{"id": 1, "name": "Veg thali", "price": 17_900},
        {"id": 2, "name": "Butter naan", "price": 6_500}]
STOCK = {1: 2_000, 2: 100_000}       # portions left today
order_lock = asyncio.Lock()          # one order at a time, like a row lock on stock


class Order(BaseModel):
    user: str
    dish_id: int
    qty: int = 1


@app.get("/menu")
async def menu():
    return MENU


@app.post("/orders")
async def place_order(order: Order):
    async with order_lock:
        await asyncio.sleep(0.02)    # stock check + insert: 20 ms, so at most ~50 orders/s
        if STOCK[order.dish_id] < order.qty:
            return {"ok": False, "error": "sold out"}      # planted: 200 for a failure
        STOCK[order.dish_id] -= order.qty
        return {"ok": True, "order_id": sum(STOCK.values())}


@app.post("/reset")                  # test environments only
async def reset(thali: int = 2_000):
    STOCK.update({1: thali, 2: 100_000})
    return {"ok": True}
pip install fastapi uvicorn
uvicorn app:app --port 8020
k6 runs from Docker. --network host lets it reach the API on localhost:
docker run --rm --network host -v "$PWD:/w" -w /w grafana/k6 run test.js
Version 1: the test most teams write first
// v1.js
import http from "k6/http";
import { check, sleep } from "k6";

const BASE = __ENV.BASE || "http://localhost:8020";
const headers = { "Content-Type": "application/json" };

export const options = {
  vus: 20,
  duration: "60s",
  thresholds: {
    http_req_duration: ["p(95)<300"],
    http_req_failed: ["rate<0.01"],
  },
};

export default function () {
  for (let i = 0; i < 3; i++) http.get(`${BASE}/menu`);           // browse
  const res = http.post(`${BASE}/orders`,
    JSON.stringify({ user: `user${__VU}`, dish_id: 1 }), { headers });
  check(res, { "order placed": (r) => r.status === 200 });
  sleep(1);                                                         // think time
}
  █ THRESHOLDS
    http_req_duration
    ✓ 'p(95)<300' p(95)=22.68ms
    http_req_failed
    ✓ 'rate<0.01' rate=0.00%

    checks_succeeded...: 100.00% 1179 out of 1179
    http_reqs......................: 4716   77.299951/s
    iterations.....................: 1179   19.324988/s
Green. But look at the last line: 19 orders a second. The business asked for 60. This test never asked the question.
Step 1: Closed model vs open model (10 minutes)
The obvious fix is more users: 60 users, each placing about one order a second. Then there is the other way to describe the same load: start 60 orders every second, whatever happens. These two are not the same test, and k6 has a different executor for each:
// rush.js (imports, BASE and headers as in v1.js)
const closed = {                       // "60 users, each orders about once a second"
  executor: "constant-vus", vus: 60, duration: "60s",
};
const open = {                         // "60 orders start every second, whatever happens"
  executor: "constant-arrival-rate", rate: 60, timeUnit: "1s", duration: "60s",
  preAllocatedVUs: 100, maxVUs: 400,
};

export const options = {
  scenarios: { rush: __ENV.MODEL === "open" ? open : closed },
  thresholds: {
    http_req_duration: ["p(95)<300"],
    http_req_failed: ["rate<0.01"],
  },
};

export default function () {
  for (let i = 0; i < 3; i++) http.get(`${BASE}/menu`, { tags: { name: "menu" } });
  const res = http.post(`${BASE}/orders`,
    JSON.stringify({ user: `user${__VU}`, dish_id: 1 }),
    { headers, tags: { name: "orders" } });
  check(res, { "order placed": (r) => r.status === 200 });
  if (__ENV.MODEL !== "open") sleep(1);
}
The closed model (constant-vus), against the same API:
    ✓ 'p(95)<300' p(95)=277.53ms
    ✓ 'rate<0.01' rate=0.00%
    checks_succeeded...: 100.00% 2819 out of 2819
    iterations.....................: 2819   46.015457/s
The open model (constant-arrival-rate, run with -e MODEL=open):
level=warning msg="Insufficient VUs, reached 400 active VUs and cannot initialize more"
    ✗ 'p(95)<300' p(95)=7.75s
    ✓ 'rate<0.01' rate=0.00%
    checks_succeeded...: 100.00% 3202 out of 3202
    dropped_iterations.............: 398    5.810434/s
    iterations.....................: 3202   46.746256/s
level=error msg="thresholds on metrics 'http_req_duration' have been crossed"
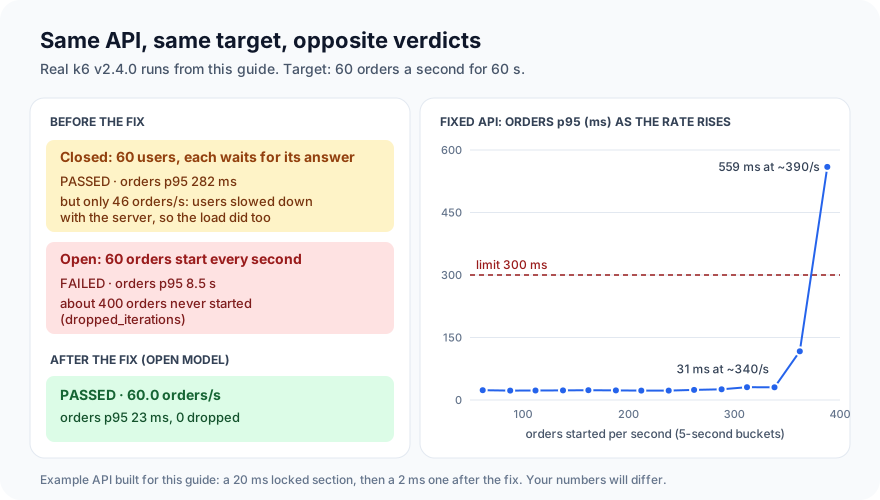
Same API, same target, opposite verdicts. Here is why.
In the closed model, each virtual user waits for its answer before it starts the next order. When the API slows down, the users slow down with it, so the load drops to whatever the API can take. Here, 60 users only managed 46 orders a second, and the slowness never got the chance to build up. Real customers don't do that. A thousand people opening the app at 12:30 don't wait for each other's orders to finish.
In the open model, k6 starts 60 orders every second whatever happens, like real arrivals. The API can only finish about 47 a second, so the queue grows every second, and waiting times climb to 7.75 s. k6 ran out of virtual users to start new orders, and 398 orders never started at all. That is dropped_iterations.
Use the open model (constant-arrival-rate or ramping-arrival-rate) when the question is "can we handle N requests a second?" Use the closed model when you really have a fixed number of users who wait, such as 40 staff using an internal tool.
Step 2: Thresholds per endpoint, and on the rate itself (5 minutes)
The test above has one http_req_duration threshold for everything. Each order comes with three menu requests that take about 2 ms, so the slow requests are a small share of the total. Give each endpoint its own threshold by tagging requests with name (already done above) and adding a threshold on the tagged metric. While we're there, add a threshold on the thing the business actually asked for, the rate:
  thresholds: {
    http_req_duration: ["p(95)<300"],
    http_req_failed: ["rate<0.01"],
    "http_req_duration{name:orders}": ["p(95)<300"],
    "http_req_duration{name:menu}": ["p(95)<100"],
    iterations: ["rate>=58"],
  },
The closed model again:
    http_req_duration
    ✓ 'p(95)<300' p(95)=277.03ms
      {name:menu}
      ✓ 'p(95)<100' p(95)=1.68ms
      {name:orders}
      ✓ 'p(95)<300' p(95)=281.71ms
    http_req_failed
    ✓ 'rate<0.01' rate=0.00%
    iterations
    ✗ 'rate>=58' rate=46.116617/s
level=error msg="thresholds on metrics 'iterations' have been crossed"
To be fair to the blended number: here the orders on their own were also under 300 ms. Per-endpoint thresholds still earn their place. A 1.7 ms menu and a 282 ms order are different stories, and on an API where reads outnumber writes by more, the fast requests will hide the slow ones. But the threshold that caught this run is the rate. If the requirement is a rate, put the rate in a threshold. Otherwise a closed-model test can pass while delivering a fraction of the load.
Step 3: Checks don't fail a run (5 minutes)
Look again at the open-model run: checks_succeeded 100.00%, 3202 out of 3202. But there were only 2,000 thalis in stock. About 1,200 of those "orders" were the API saying "sold out", with status 200. The check only looked at the status.
Two problems, and both are common:
- The check looked at the status code, not the answer. Check the body too.
- A failing check doesn't fail the run. k6 reports checks, but the exit code only depends on thresholds. Add a threshold on
checks.
And a third, about the test data: the test assumed there would be enough stock, without making sure. setup() runs once before the load starts; use it to put the data in a known state.
Here is the full version 3, open model, with all of that. It also reads its users from a CSV through SharedArray, so 400 virtual users share one copy instead of loading 400:
// rush_v3.js
import http from "k6/http";
import { check } from "k6";
import { SharedArray } from "k6/data";

const BASE = __ENV.BASE || "http://localhost:8020";
const headers = { "Content-Type": "application/json" };

// 500 test users, loaded once and shared by every VU.
const users = new SharedArray("users", () =>
  open("./users.csv").split("\n").slice(1).filter(Boolean));

export const options = {
  scenarios: {
    rush: {
      executor: "constant-arrival-rate", rate: 60, timeUnit: "1s", duration: "60s",
      preAllocatedVUs: 100, maxVUs: 400,
    },
  },
  thresholds: {
    "http_req_duration{name:menu}": ["p(95)<100"],
    "http_req_duration{name:orders}": ["p(95)<300"],
    http_req_failed: ["rate<0.01"],
    checks: ["rate>0.99"],
    dropped_iterations: ["count<1"],
  },
};

export function setup() {
  // Known data before every run: enough thalis for 60/s for 60 s.
  const res = http.post(`${BASE}/reset?thali=${__ENV.THALI || 5000}`);
  if (res.status !== 200) throw new Error(`reset failed: ${res.status}`);
}

export default function () {
  for (let i = 0; i < 3; i++) http.get(`${BASE}/menu`, { tags: { name: "menu" } });
  const user = users[Math.floor(Math.random() * users.length)];
  const res = http.post(`${BASE}/orders`,
    JSON.stringify({ user, dish_id: 1 }), { headers, tags: { name: "orders" } });
  check(res, {
    "order placed": (r) => r.status === 200 && r.json("ok") === true,
  });
}

export function handleSummary(data) {
  const m = data.metrics;
  const short = {
    orders_p95_ms: m["http_req_duration{name:orders}"].values["p(95)"],
    menu_p95_ms: m["http_req_duration{name:menu}"].values["p(95)"],
    orders_per_s: m.iterations.values.rate,
    dropped: m.dropped_iterations ? m.dropped_iterations.values.count : 0,
    checks_rate: m.checks.values.rate,
  };
  return {
    stdout: JSON.stringify(short, null, 2) + "\n",
    "summary.json": JSON.stringify(data, null, 2),
  };
}
handleSummary replaces k6's end-of-test output with your own. Here that is a short summary on screen and the full data in summary.json for CI to keep. One catch: once you return stdout, k6's usual summary is gone, so print what you need.
To see the check working, run it with the old stock of 2,000 thalis, -e THALI=2000:
{
  "orders_p95_ms": 8485.18389665,
  "menu_p95_ms": 1.63783975,
  "orders_per_s": 46.75651262857817,
  "dropped": 398,
  "checks_rate": 0.6246096189881324
}
level=error msg="thresholds on metrics 'checks, dropped_iterations, http_req_duration{name:orders}' have been crossed"
summary.json has the exact count: "passes": 2000, "fails": 1202. Every thali sold, then 1,202 failures that version 1 counted as successes. With the default 5,000 thalis the check passes, and the run still fails on speed and dropped orders. k6 exits with code 99 when a threshold is crossed, which turns a CI job red.
Step 4: Fix it and run again (5 minutes)
The fix on the API side, in the example: hold the lock only for the stock update, and do the slow part (here, an 18 ms payment call) outside it. And say "sold out" with a status that means it, 409 Conflict:
@app.post("/orders")
async def place_order(order: Order):
    async with order_lock:             # hold the lock only for the stock update
        await asyncio.sleep(0.002)     # 2 ms
        if STOCK[order.dish_id] < order.qty:
            raise HTTPException(409, "sold out")
        STOCK[order.dish_id] -= order.qty
        order_id = sum(STOCK.values())
    await asyncio.sleep(0.018)         # payment call: 18 ms, no lock needed
    return {"ok": True, "order_id": order_id}
Each order still takes about 20 ms, but only 2 ms of it is spent holding the lock. Version 3 again:
{
  "orders_p95_ms": 22.978024,
  "menu_p95_ms": 1.6793951,
  "orders_per_s": 59.98472014837337,
  "dropped": 0,
  "checks_rate": 1
}
exit 0
60 orders a second, orders answered in 23 ms, nothing dropped.
Step 5: Find the new limit (10 minutes)
Passing at 60 tells you nothing about 200. To find where the fixed API slows down, raise the arrival rate steadily and stop the test once it goes past the limit, with ramping-arrival-rate and abortOnFail:
// limit.js
import http from "k6/http";
import { check } from "k6";
import exec from "k6/execution";

const BASE = __ENV.BASE || "http://localhost:8020";
const headers = { "Content-Type": "application/json" };

export const options = {
  scenarios: {
    find_limit: {
      executor: "ramping-arrival-rate", startRate: 50, timeUnit: "1s",
      preAllocatedVUs: 200, maxVUs: 1000,
      stages: [{ target: 600, duration: "110s" }],   // +5 orders/s every second
    },
  },
  thresholds: {
    "http_req_duration{name:orders}": [
      { threshold: "p(95)<300", abortOnFail: true, delayAbortEval: "10s" },
    ],
  },
};

export function setup() { http.post(`${BASE}/reset?thali=1000000`); }

export default function () {
  const res = http.post(`${BASE}/orders`,
    JSON.stringify({ user: `user${exec.vu.idInTest}`, dish_id: 1 }),
    { headers, tags: { name: "orders" } });
  check(res, { "order placed": (r) => r.status === 200 });
}
    ✗ 'p(95)<300' p(95)=449.63ms
find_limit ✗ [  67% ] 0240/0256 VUs  1m14.0s/1m50s  419.85 iters/s
level=error msg="thresholds on metrics 'http_req_duration{name:orders}' were crossed;
  at least one has abortOnFail enabled, stopping test prematurely"
It stopped at 74 seconds, at about 420 orders a second. That is not the limit, and the reason is worth knowing: the threshold is a p95 over the whole run so far, including a minute of fast early requests, so it trips late. To see where it really bent, we ran it again with --out csv=limit.csv and worked out p95 for each 5-second slice:
| Seconds | Orders started per second | p95 |
|---|---|---|
| 0–5 | ~62 | 23 ms |
| 25–30 | ~188 | 23 ms |
| 45–50 | ~288 | 26 ms |
| 55–60 | ~338 | 31 ms |
| 60–65 | ~362 | 117 ms |
| 65–70 | ~388 | 559 ms |
The fixed API on this laptop holds to about 340 orders a second, then the queue builds quickly. That is more than five times the promotion's target. That's the number to write down, and to re-test whenever the order code changes.
Executors at a glance
| Executor | Model | Use it for |
|---|---|---|
constant-vus |
Closed | A fixed number of users who wait for each answer |
ramping-vus |
Closed | The same, growing and shrinking |
constant-arrival-rate |
Open | "Can we take N requests a second?" |
ramping-arrival-rate |
Open | Finding the limit; traffic that builds up |
shared-iterations / per-vu-iterations |
Closed | A fixed amount of work, such as a data load |
Habits worth keeping
- Requirement says "per second"? Use an arrival-rate executor, and put the rate in a threshold.
- Watch
dropped_iterations. Every dropped iteration is a request your test meant to send and didn't. Give it a threshold ofcount<1. - Tag requests by endpoint and set thresholds per tag.
- Checks look at the answer, not just the status, and get a threshold. On their own they never fail a run.
- Put the test data in a known state in
setup(). "Sold out" halfway through is a data problem, not a performance result. - Don't read the limit off an aborted run. Look at the time series.
What's next
A laptop and one process are fine for finding a bug like this lock. To know what production can take, the load has to come from outside your network, at the right rate, and you need to compare each run with the last one. ProvaLab's load testing runs your k6 tests and JMeter plans on ProvaLab's own runners, compares each run with a baseline so a slower build can fail the pipeline, and keeps the trend across runs. See it in the two-minute product tour.
New to k6? Start with Your first load test with k6. For the same "is my test telling the truth?" questions applied to pytest, read pytest in practice.
See ProvaLab working on a real app
Your coding agent runs the tests, reads the failures and fixes them.