Hands-On Testing · Part 7
Your first load test with k6 (hands-on): find where your API slows down
ProvaLab team · · 8 min read
Performance testing types explained load, stress, spike and soak tests. This final post of the Hands-On series runs two of them for real, with k6, against the discount API from Part 4:
- A load test at the expected peak: does it hold up?
- A stress test past the peak: where does it slow down, and does it break?
Every command and every line of output below was run while writing this post.
Before you start: a load test is, by definition, a flood of traffic. Only ever point it at something you own, and never at production without a plan. Our target is the API from Part 4, running on our own machine.
Step 1: Get k6 (1 minute)
k6 is a single program. Install it from k6.io for your operating system, or run it from its container image, which is what we do here:
docker pull grafana/k6:latest
docker run --rm grafana/k6:latest version
k6 v2.3.0 (commit/e088784614, go1.27.1, linux/amd64)
Step 2: Start the target (1 minute)
In the Part 4 folder, with the fixed version of the API from Part 6:
uvicorn app:app
One request by hand, to know what "normal" looks like before we add load:
curl -s -o /dev/null -w "%{http_code} in %{time_total}s\n" -X POST http://127.0.0.1:8000/discounts/apply \
  -H "Authorization: Bearer token-alice" -H "Content-Type: application/json" \
  -d '{"order_total": 500, "code": "SAVE10"}'
200 in 0.039147s
Forty milliseconds for one request, on an idle machine. The question load testing answers is: what happens to that number when it's fifty requests at once?
Step 3: Write the load test (4 minutes)
Create a folder called k6 and in it load.js:
import http from "k6/http";
import { check, sleep } from "k6";

const BASE = __ENV.API_URL || "http://127.0.0.1:8000";
const HEADERS = { Authorization: "Bearer token-alice", "Content-Type": "application/json" };

export const options = {
  stages: [
    { duration: "30s", target: 50 }, // ramp up to 50 users
    { duration: "60s", target: 50 }, // hold the expected peak
    { duration: "15s", target: 0 },  // ramp down
  ],
  thresholds: {
    http_req_duration: ["p(95)<200"], // 95% of requests under 200 ms
    http_req_failed: ["rate<0.01"],   // less than 1% errors
  },
};

export default function () {
  // 7 in 10 users apply a discount, 3 in 10 look at an order
  if (Math.random() < 0.7) {
    const res = http.post(`${BASE}/discounts/apply`, JSON.stringify({ order_total: 500, code: "SAVE10" }), { headers: HEADERS });
    check(res, { "discount applied": (r) => r.status === 200 && r.json("total") === 450 });
  } else {
    const res = http.get(`${BASE}/orders/42`, { headers: HEADERS });
    check(res, { "order returned": (r) => r.status === 200 });
  }
  sleep(1); // think time: a real user pauses between actions
}
The four ideas in this file are the four ideas in any load test:
- Stages describe the shape of the load over time: ramp up, hold, ramp down. The ramp matters; starting 50 users in the same millisecond tests something different (that's a spike test).
- Thresholds are the pass/fail rules, decided before running: p95 under 200 ms, under 1% errors. Without them you get numbers but no verdict.
- The default function is what one virtual user (VU) does, over and over: here, a realistic mix of two actions.
- Think time (
sleep(1)) is the pause a real person takes between actions. Without it, 50 virtual users behave like thousands of real ones.
The check lines are the load test's assertions: a 200 with the right total. A load test that only counts responses would happily report success while every response was an error page.
Step 4: Run it (2 minutes)
docker run --rm --network host -e API_URL=http://127.0.0.1:8000 -v "$PWD/k6:/scripts" \
  grafana/k6:latest run /scripts/load.js
(As in Part 6, on macOS and Windows use http://host.docker.internal:8000 and drop --network host.)
k6 prints a progress line every second, then the summary:
  █ TOTAL RESULTS

    checks_total.......: 4145    39.338342/s
    checks_succeeded...: 100.00% 4145 out of 4145
    checks_failed......: 0.00%   0 out of 4145

    ✓ discount applied
    ✓ order returned

    HTTP
    http_req_duration..............: avg=1.91ms min=975.39µs med=1.68ms max=16.09ms p(90)=2.7ms p(95)=3.15ms
    http_req_failed................: 0.00%  0 out of 4145
    http_reqs......................: 4145   39.338342/s

    EXECUTION
    iteration_duration.............: avg=1s     min=1s       med=1s     max=1.01s   p(90)=1s    p(95)=1s
    iterations.....................: 4145   39.338342/s
    vus............................: 1      min=1         max=50
    vus_max........................: 50     min=50        max=50

default ✓ [ 100% ] 00/50 VUs  1m45s
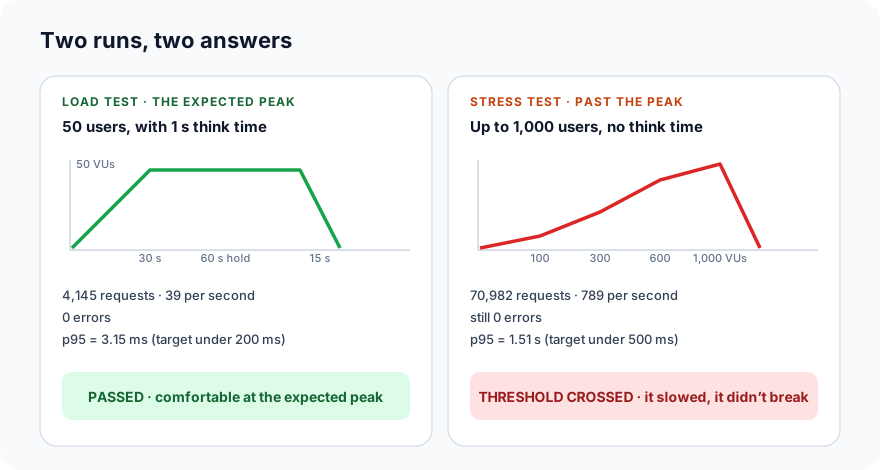
Passed. 4,145 requests over 1 minute 45, every check green, no failures, and a p95 of 3.15 ms against a target of 200 ms. At its expected peak this API isn't remotely stressed. (The "iteration_duration" of 1 s is just the think time.)
Note the tick next to default and the absence of any threshold error: that's k6's verdict. In CI, a crossed threshold makes k6 exit with a non-zero code, which fails the job.
Step 5: Stress it (5 minutes)
Passing at 50 users tells you it's fine today. It doesn't tell you how much headroom you have, or what failure looks like. For that, keep increasing the load past the expected peak until something gives. Create stress.js:
import http from "k6/http";
import { check } from "k6";

const BASE = __ENV.API_URL || "http://127.0.0.1:8000";
const HEADERS = { Authorization: "Bearer token-alice", "Content-Type": "application/json" };

export const options = {
  stages: [
    { duration: "20s", target: 100 },
    { duration: "20s", target: 300 },
    { duration: "20s", target: 600 },
    { duration: "20s", target: 1000 }, // keep going past the expected peak
    { duration: "10s", target: 0 },
  ],
  thresholds: {
    // we expect these to fail: the point is to see where
    http_req_duration: ["p(95)<500"],
    http_req_failed: ["rate<0.05"],
  },
};

export default function () {
  const res = http.post(`${BASE}/discounts/apply`, JSON.stringify({ order_total: 500, code: "SAVE10" }), { headers: HEADERS });
  check(res, { "status 200": (r) => r.status === 200 });
  // no think time: every virtual user hammers the API as fast as it can
}
Two deliberate changes: the load climbs in steps to 1,000 users, and there's no think time, so each virtual user sends requests as fast as the API answers. Run it the same way, with stress.js:
  █ TOTAL RESULTS

    checks_total.......: 70982   788.671898/s
    checks_succeeded...: 100.00% 70982 out of 70982
    checks_failed......: 0.00%   0 out of 70982

    ✓ status 200

    HTTP
    http_req_duration..............: avg=498.54ms min=731.6µs med=430.55ms max=1.79s p(90)=1.1s p(95)=1.51s
    http_req_failed................: 0.00% 0 out of 70982
    http_reqs......................: 70982 788.671898/s

    EXECUTION
    vus............................: 13    min=5          max=997
    vus_max........................: 1000  min=1000       max=1000

default ✓ [ 100% ] 0000/1000 VUs  1m30s
time="2026-10-29T18:31:28Z" level=error msg="thresholds on metrics 'http_req_duration' have been crossed"
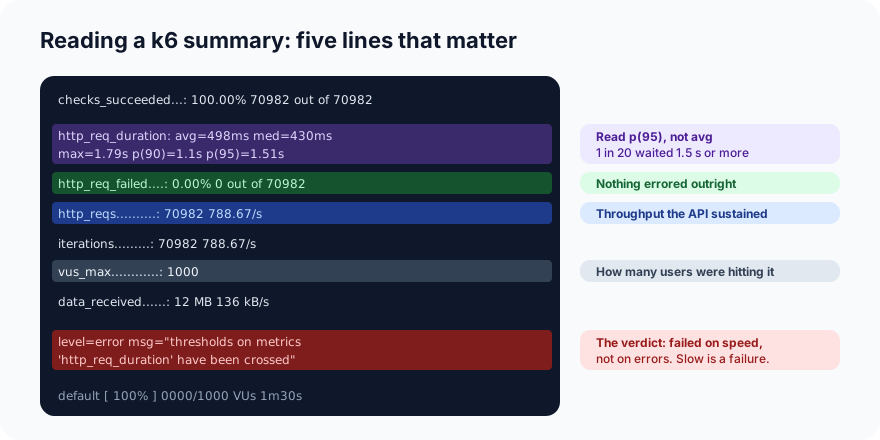
Read it line by line:
- 70,982 requests in 90 seconds, 789 per second. Twenty times the load test's rate.
- Still 0% failed, every check green. The API never fell over. Every one of 70,982 requests got a correct
200. - But p95 is 1.51 s, and the maximum 1.79 s. One in twenty customers would wait a second and a half for a discount to apply. That's the threshold k6 crossed, and the reason the run is marked failed.
So the honest answer from this stress test is: this API doesn't break under 1,000 hammering users; it slows down, from 3 ms to 1.5 s at the 95th percentile. That's the "breaking point" for a single-process server: the point where the queue of waiting requests grows faster than it drains. Whether that's acceptable depends on your product, which is exactly why thresholds are written down before the run.
What we'd do next
- Find the knee. Re-run with finer steps (200, 250, 300…) to find the user count where p95 first crosses 500 ms. That number is your capacity, and it belongs in the test plan.
- Watch the server, not just k6. CPU, memory and, for a real app, the database. Here the limit is one Python process on one core;
uvicorn --workers 4would roughly quadruple it. Load testing tells you that it slows; server metrics tell you why. - Run it from a separate machine. We ran k6 on the same laptop as the API, so they competed for CPU. For real numbers the load generator must not share resources with the target, and for big loads it must be several machines.
- Add a soak run: 50 users for two hours, to catch memory leaks a 90-second test never will.
Putting it in the pipeline
Nightly, not on every commit (a load test takes minutes and needs a quiet environment):
      - run: uvicorn app:app &
      - run: >
          docker run --rm --network host -e API_URL=http://127.0.0.1:8000
          -v "$PWD/k6:/scripts" grafana/k6:latest run /scripts/load.js
If the thresholds are crossed, k6 exits non-zero and the job goes red. Over months, that catches the commit that made things slower.
Habits worth keeping
- Decide the thresholds before you run. Numbers without a target are trivia.
- Read p95 and p99, never the average. The average in the stress run (498 ms) hid a p95 three times worse.
- Assert on the response, not just the status. A fast wrong answer is still wrong.
- Model real behaviour: a mix of actions, with think time. Drop the think time only when you mean to stress.
- Never load-test what you don't own. And never production without warning the people who run it.
Hands-On Testing: the complete series
That closes the series. Over seven parts you've built and run:
- UI testing explained · 2. Your first Playwright test
- API testing explained · 4. Your first API tests
- Security testing basics: the OWASP Top 10 · 6. Your first security scan with OWASP ZAP
- Your first load test with k6 (this post)
Together with the 23-part Testing Basics series, that's a complete foundation: the ideas, and the tools in your hands.
ProvaLab's load testing runs k6 tests like these from the cloud, on machines that don't compete with your app, shows p95 and throughput live, and can find the user count where your API first slows down, step by step. Your coding agent can write the script from your code and explain the slow spots afterwards. See it in the two-minute product tour.
Prefer to read offline? The whole Hands-On Testing series is one free PDF: get the PDF.
See ProvaLab working on a real app
Your coding agent runs the tests, reads the failures and fixes them.